By Tony Kaye, Senior Personal Finance Writer, Vanguard Australia
In early 2020, over just a few weeks, global share markets tumbled more than 35 per cent.
Sparked by investor panic over the rapid spread of the COVID-19 virus, it was one of the biggest-ever market downturns.
Yet, by the end of last year, markets had recovered most of their lost ground. What’s more, they were once again trading near record highs.

It’s only when you take a long-term view of the performance of share markets over time that you get to see the bigger investment picture.
And it shows that while markets do experience volatility and can sometimes fall quite sharply over short periods, they consistently rise over longer time frames.
Investors who stay the course, rather than trying to time when to buy and sell, tend to be more successful in the long run.
If you invest in products such as managed funds and exchange traded funds that provide broad exposures to markets, you essentially capture the rising returns from those markets over time.
The 2021 Vanguard Index Chart below shows the performance of six different asset types over the last 30 years since 30 June 1991.
These assets are Australian shares, United States shares, international shares, Australian bonds, listed property, and cash.
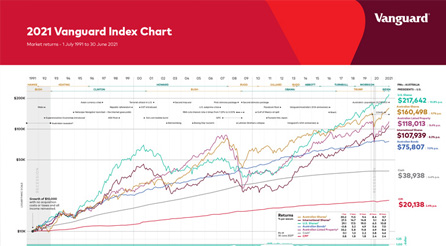
As well as mapping the performance of these assets, the chart shows how a starting investment of $10,000 would have grown over 30 years. The total numbers don’t include any buying costs or taxes and assume all the income received along the way was reinvested back into the same assets.
You can clearly see how investment markets have risen and fallen over time. As well, you can see the shorter-term impacts of major events including the Global Financial Crisis in 2008 and last year’s COVID-19 crash.
How different assets have performed
A $10,000 investment in mid-1991 into the U.S. share market would have grown to $217,642 by 30 June 2021 if all income received had been reinvested back into U.S. shares. That’s based on the 10.8 per cent average annual return from the broad U.S. market over 30 years.
The Vanguard chart also shows how someone who had invested $10,000 back then would have ended up by investing in other asset types.
The same amount invested into Australian shares would have grown to $160,498 based on the 9.7 per cent per annum return from the Australian share market since the start of the 1991-92 financial year.
Left in listed property, which has returned 8.6 per cent per annum, a $10,000 investment would have increased more than 10 times to $118,013. The same goes for international shares, although its 8.3 per cent per annum return delivered a slightly lower outcome and would have turned $10,000 into $107,939.
In Australian bonds, which have returned 7 per cent per annum over 30 years, a $10,000 starting investment would have been worth $75,807 at 30 June this year.
The lowest long-term return over three decades has been from cash.
If you’d left your money in cash it would have earned 4.6 per cent per annum and grown to $38,938. It’s a much lower return than from other asset types. But it’s still almost four times the original amount invested.
The importance of diversification
The returns from the different assets tracked in the Vanguard Index Chart over the last 30 years demonstrates a few key points.
Some assets are more prone to volatility than others. You can see that by comparing how different types of shares have performed over time against the more stable returns of lower-risk assets such as bonds and cash.
During times of uncertainty, shares are likely to be much more volatile than fixed income assets such as bonds. Cash returns, which closely reflect official interest rates, are largely unaffected by what happens on share markets.
You can also see that the returns from different assets vary from year to year. The best-performing assets in some years can be the worst-performing in others.
In the 2020-21 financial year listed property achieved a positive return of 33.2 per cent, which compared with a negative return of 21.3 per cent the year before.
Lastly, the best way to smooth out intermittent volatility and to achieve more consistent returns is to spread your holdings over a range of assets.
The power of compounding returns
The overall financial returns shown in the Vanguard Index Chart are based on an investor having reinvested any income received from their investments back into the same asset type.
By following a strategy of reinvesting investment distributions such as dividends, and by making additional contributions over a long period of time, the combination of market growth and compounding returns will likely deliver strong results.
It’s why famous scientist Albert Einstein famously described compound interest as “the eighth wonder of the world”.
Even a low initial balance will grow substantially over time when combined with compounding investment returns.
If you would like to discuss your current investment portfolio or would like more information about long-term investing, call us on (08) 8363 9222.
Source: Vanguard August 2021
Reproduced with permission of Vanguard Investments Australia Ltd
Vanguard Investments Australia Ltd (ABN 72 072 881 086 / AFS Licence 227263) is the product issuer. We have not taken yours and your clients’ circumstances into account when preparing this material so it may not be applicable to the particular situation you are considering. You should consider your circumstances and our Product Disclosure Statement (PDS) or Prospectus before making any investment decision. You can access our PDS or Prospectus online or by calling us. This material was prepared in good faith and we accept no liability for any errors or omissions. Past performance is not an indication of future performance.
© 2021 Vanguard Investments Australia Ltd. All rights reserved.
Important:
Any information provided by the author detailed above is separate and external to our business and our Licensee. Neither our business nor our Licensee takes any responsibility for any action or any service provided by the author. Any links have been provided with permission for information purposes only and will take you to external websites, which are not connected to our company in any way. Note: Our company does not endorse and is not responsible for the accuracy of the contents/information contained within the linked site(s) accessible from this page.